안녕하세요 코딩하는 공대생입니다
github에 올라와있는 오픈소스를 이용하여 안드로이드 앱에 이쁜 차트를 그리는 방법을 설명하겠습니다
아래의 깃허브 링크에 있는 차트를 활용해 볼 것 입니다
https://github.com/lecho/hellocharts-android
lecho/hellocharts-android
Charts/graphs library for Android compatible with API 8+, several chart types with support for scaling, scrolling and animations - lecho/hellocharts-android
github.com
참고한 소스링크
- fragment_line_column_dependency.xml
lecho/hellocharts-android
Charts/graphs library for Android compatible with API 8+, several chart types with support for scaling, scrolling and animations - lecho/hellocharts-android
github.com
- LineColumnDependencyActivity.java
lecho/hellocharts-android
Charts/graphs library for Android compatible with API 8+, several chart types with support for scaling, scrolling and animations - lecho/hellocharts-android
github.com
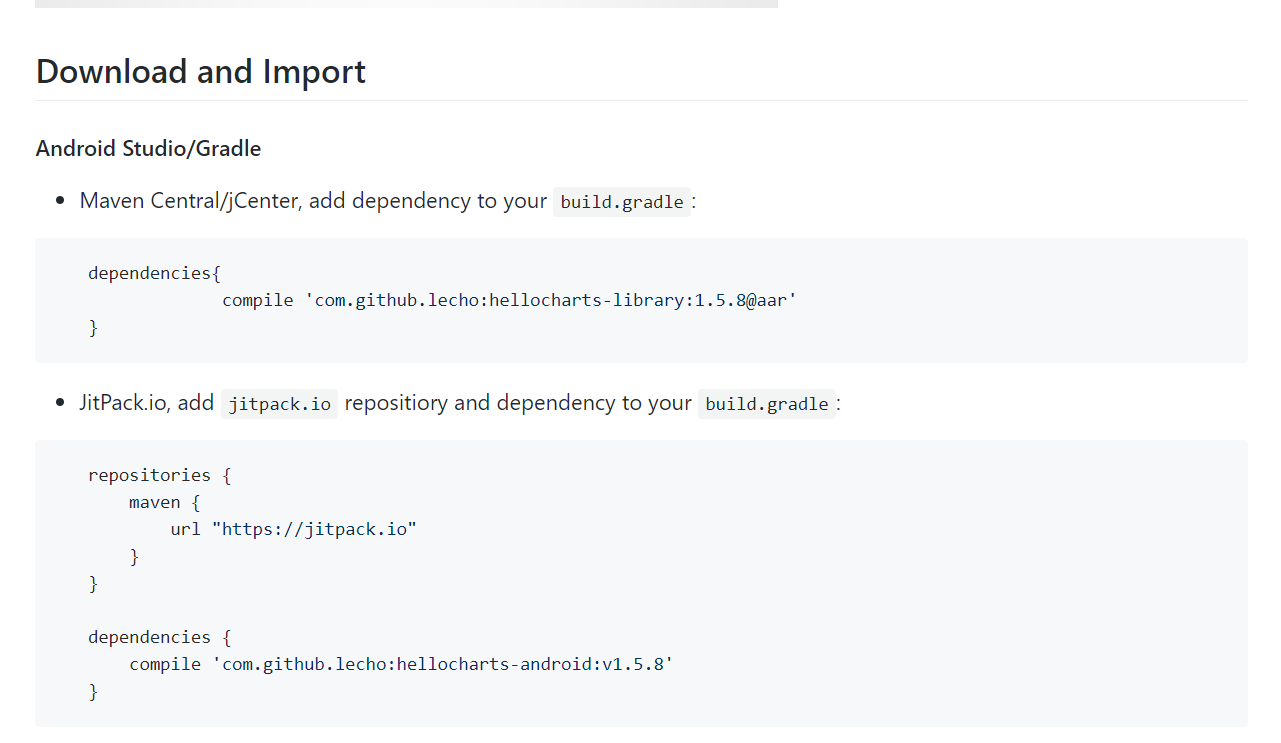
- Android에 추가할 것

| build.gradle(project)의 dependencies | implementation 'com.github.lecho:hellocharts-library:1.5.8@aar' 추가 |
| build.gradle(app) 안에 maven,dependencies | url "https://jitpack.io" |
| classpath 'com.github.lecho:hellocharts-android:v1.5.8 |
위의 표를 보시고 넣으시면 됩니다
잘 모르시겠으면 아래의 사진을 보고 따라하셔도 됩니다

build.gradle(project)의 dependencies 안에 넣은 사진

build.gradle(app)의 maven와 dependencies 안에 넣은 사진
간략하게 소개해드리자면 github에 코드를 올리신 분은 fragmentlayout을 메인에 띄워 놓고
그릴려고 하는 차트 xml은 따로 만들어서 메인에 있는 fragment에 그릴려고하는 차트 xml의 화면을 교체하여서
띄우는 방식으로 했습니다
<?xml version="1.0" encoding="utf-8"?>
<LinearLayout xmlns:android="http://schemas.android.com/apk/res/android"
    android:orientation="vertical" android:layout_width="match_parent"
    android:layout_height="match_parent">

    <lecho.lib.hellocharts.view.LineChartView
        android:id="@+id/chart_top"
        android:layout_width="match_parent"
        android:layout_height="0dp"
        android:layout_weight="1" >
    </lecho.lib.hellocharts.view.LineChartView>

    <View
        android:layout_width="match_parent"
        android:layout_height="2dp"
        android:layout_marginBottom="8dp"
        android:layout_marginTop="8dp"
        android:background="@android:color/darker_gray" />

    <lecho.lib.hellocharts.view.ColumnChartView
        android:id="@+id/chart_bottom"
        android:layout_width="match_parent"
        android:layout_height="0dp"
        android:layout_weight="1" >
    </lecho.lib.hellocharts.view.ColumnChartView>
</LinearLayout>
previewlinechart.xml
<LinearLayout xmlns:android="http://schemas.android.com/apk/res/android"
    xmlns:tools="http://schemas.android.com/tools"
    android:layout_width="match_parent"
    android:layout_height="match_parent"
    android:orientation="vertical">

  <FrameLayout
      android:id="@+id/container"
      android:layout_width="wrap_content"
      android:layout_height="wrap_content">

  </FrameLayout>


</LinearLayout>
activity_main.xml
import androidx.appcompat.app.AppCompatActivity;
import androidx.fragment.app.Fragment;

import android.graphics.Color;
import android.os.Bundle;
import android.view.LayoutInflater;
import android.view.View;
import android.view.ViewGroup;
import android.widget.LinearLayout;

import java.util.ArrayList;
import java.util.List;

import lecho.lib.hellocharts.gesture.ContainerScrollType;
import lecho.lib.hellocharts.gesture.ZoomType;
import lecho.lib.hellocharts.listener.ColumnChartOnValueSelectListener;
import lecho.lib.hellocharts.model.Axis;
import lecho.lib.hellocharts.model.AxisValue;
import lecho.lib.hellocharts.model.Column;
import lecho.lib.hellocharts.model.ColumnChartData;
import lecho.lib.hellocharts.model.Line;
import lecho.lib.hellocharts.model.LineChartData;
import lecho.lib.hellocharts.model.PointValue;
import lecho.lib.hellocharts.model.SubcolumnValue;
import lecho.lib.hellocharts.model.Viewport;
import lecho.lib.hellocharts.util.ChartUtils;
import lecho.lib.hellocharts.view.Chart;
import lecho.lib.hellocharts.view.ColumnChartView;
import lecho.lib.hellocharts.view.ComboLineColumnChartView;
import lecho.lib.hellocharts.view.LineChartView;

public class MainActivity extends AppCompatActivity {

    @Override
    protected void onCreate(Bundle savedInstanceState) {
        super.onCreate(savedInstanceState);
        setContentView(R.layout.activity_main);
        if (savedInstanceState == null) {
            getSupportFragmentManager().beginTransaction().add(R.id.container, new PlaceholderFragment()).commit();
        }

    }

    public static class PlaceholderFragment extends Fragment {
        public final static String[] months = new String[]{"Jan", "Feb", "Mar", "Apr", "May", "Jun", "Jul", "Aug",
                "Sep", "Oct", "Nov", "Dec",};

        public final static String[] days = new String[]{"Mon", "Tue", "Wen", "Thu", "Fri", "Sat", "Sun",};

        private LineChartView chartTop;
        private ColumnChartView chartBottom;

        private LineChartData lineData;
        private ColumnChartData columnData;

        public PlaceholderFragment() {
        }

        @Override
        public View onCreateView(LayoutInflater inflater, ViewGroup container, Bundle savedInstanceState) {
            View rootView = inflater.inflate(R.layout.previewlinechart, container, false);

            // *** TOP LINE CHART ***
            chartTop = (LineChartView) rootView.findViewById(R.id.chart_top);

            // Generate and set data for line chart
            generateInitialLineData();

            // *** BOTTOM COLUMN CHART ***

            chartBottom = (ColumnChartView) rootView.findViewById(R.id.chart_bottom);

            generateColumnData();

            return rootView;
        }

        private void generateColumnData() {

            int numSubcolumns = 1;
            int numColumns = months.length;

            List<AxisValue> axisValues = new ArrayList<AxisValue>();
            List<Column> columns = new ArrayList<Column>();
            List<SubcolumnValue> values;
            for (int i = 0; i < numColumns; ++i) {

                values = new ArrayList<SubcolumnValue>();
                for (int j = 0; j < numSubcolumns; ++j) {
                    values.add(new SubcolumnValue((float) Math.random() * 50f + 5, ChartUtils.pickColor()));
                }

                axisValues.add(new AxisValue(i).setLabel(months[i]));

                columns.add(new Column(values).setHasLabelsOnlyForSelected(true));
            }

            columnData = new ColumnChartData(columns);

            columnData.setAxisXBottom(new Axis(axisValues).setHasLines(true));
            columnData.setAxisYLeft(new Axis().setHasLines(true).setMaxLabelChars(2));

            chartBottom.setColumnChartData(columnData);

            // Set value touch listener that will trigger changes for chartTop.
            chartBottom.setOnValueTouchListener(new ValueTouchListener());

            // Set selection mode to keep selected month column highlighted.
            chartBottom.setValueSelectionEnabled(true);

            chartBottom.setZoomType(ZoomType.HORIZONTAL);

            // chartBottom.setOnClickListener(new View.OnClickListener() {
            //
            // @Override
            // public void onClick(View v) {
            // SelectedValue sv = chartBottom.getSelectedValue();
            // if (!sv.isSet()) {
            // generateInitialLineData();
            // }
            //
            // }
            // });

        }

        /**
         * Generates initial data for line chart. At the begining all Y values are equals 0. That will change when user
         * will select value on column chart.
         */
        private void generateInitialLineData() {
            int numValues = 7;

            List<AxisValue> axisValues = new ArrayList<AxisValue>();
            List<PointValue> values = new ArrayList<PointValue>();
            for (int i = 0; i < numValues; ++i) {
                values.add(new PointValue(i, 0));
                axisValues.add(new AxisValue(i).setLabel(days[i]));
            }

            Line line = new Line(values);
            line.setColor(ChartUtils.COLOR_GREEN).setCubic(true);

            List<Line> lines = new ArrayList<Line>();
            lines.add(line);

            lineData = new LineChartData(lines);
            lineData.setAxisXBottom(new Axis(axisValues).setHasLines(true));
            lineData.setAxisYLeft(new Axis().setHasLines(true).setMaxLabelChars(3));

            chartTop.setLineChartData(lineData);

            // For build-up animation you have to disable viewport recalculation.
            chartTop.setViewportCalculationEnabled(false);

            // And set initial max viewport and current viewport- remember to set viewports after data.
            Viewport v = new Viewport(0, 110, 6, 0);
            chartTop.setMaximumViewport(v);
            chartTop.setCurrentViewport(v);

            chartTop.setZoomType(ZoomType.HORIZONTAL);
        }

        private void generateLineData(int color, float range) {
            // Cancel last animation if not finished.
            chartTop.cancelDataAnimation();

            // Modify data targets
            Line line = lineData.getLines().get(0);// For this example there is always only one line.
            line.setColor(color);
            for (PointValue value : line.getValues()) {
                // Change target only for Y value.
                value.setTarget(value.getX(), (float) Math.random() * range);
            }

            // Start new data animation with 300ms duration;
            chartTop.startDataAnimation(300);
        }

        private class ValueTouchListener implements ColumnChartOnValueSelectListener {

            @Override
            public void onValueSelected(int columnIndex, int subcolumnIndex, SubcolumnValue value) {
                generateLineData(value.getColor(), 100);
            }

            @Override
            public void onValueDeselected() {

                generateLineData(ChartUtils.COLOR_GREEN, 0);

            }
        }
    }


}
MainActivity.java
위의 소스는 package 명을 제외한 소스입니다 붙여넣으실때 자신의 pakage com. 아래에 복사하시면 됩니다
저의 안드로이드 버전은 3.5.3 입니다
혹시 모르게 버전 차이로 오류날 수 있으니 아래의 사진을 참고하시길 바랍니다
